A public-safety investigation into crash hotspots, road design and whether transportation projects are following the danger
Florence County, South Carolina – Florence County’s crash problem is not spread evenly across the map. The public records available so far point again and again to the same road names: US 52, US 76, SC 51, I-95 and key secondary routes such as S-13, S-29 and S-12.
These are not obscure backroads. They are the everyday corridors that carry workers, school traffic, shoppers, freight trucks, emergency vehicles, tourists, and local residents moving between neighborhoods, downtown Florence, commercial strips, rural communities and interstate exits.
The question is no longer whether Florence County has dangerous roads. It does. The better question is sharper: are the road projects now moving through SCDOT, FLATS MPO and local planning channels aimed at the same corridors where serious crashes keep appearing?
This review uses official state and federal sources, including South Carolina Department of Public Safety traffic collision materials, the SCDPS High Crash Collision Corridors dashboard, SCDOT traffic-count and GIS resources, the SCDOT Programmed Project Viewer, FLATS MPO funding documents, and NHTSA fatal crash data.
SCDOT says its Programmed Project Viewer highlights programmed projects administered by the agency, while its Traffic Analysis and Data Application includes AADT data from more than 12,000 locations statewide.
Read also: We analyze: Where Florence’s money really goes as city and county budgets climb
This article is built as the first piece in a broader public-safety series. It does not claim to replace a full crash-level extract from the state’s traffic collision database. But the public record already gives a strong starting point: Florence County’s crash burden appears concentrated around a relatively small group of high-volume, high-conflict corridors — and many of those same places now have planned, funded or partially funded road-safety projects.
What the public data can show — and what it cannot show yet
The public data available for Florence County can identify broad crash patterns, top roadways, top intersections, fatal-crash records, traffic volumes, and transportation projects. It can also show where SCDOT and FLATS MPO are spending money on intersection upgrades, vulnerable road user safety, roadway-departure mitigation, bridge planning and signal work.
What the public data does not fully provide is the crash-level microdata needed to calculate every corridor precisely. That would include every Florence County crash from 2022 through 2024 in a data set not currently available and provided by officials.
That information exists in the state system. SCDPS says the Highway Safety Statistics Section maintains the South Carolina traffic collision database, and the state’s highway safety planning documents describe the Traffic Collision Statistical Database as the source used to create state collision calculations.
Methodology
This investigation uses 2022, 2023 and 2024 as the main review period because that is the most useful three-year window for local safety analysis. The most complete publicly available SCDPS Fact Books currently found cover prior calendar years, with 2023 appearing to be the latest fully published Fact Book located through SCDPS public materials. Because full 2025 collision data appears provisional or incomplete, this article treats 2025 project and planning records as context, not as the main crash-count period.
Sources reviewed
| Source | What it was used for | Why it matters |
| SCDPS Traffic Collision Fact Books | County-level totals, top roads, top intersections, major contributing factors | Main official summary of South Carolina crash patterns |
| SCDPS traffic collision database references | Explains where full crash-level records are maintained | Required for exact corridor-level calculations |
| South Carolina High Crash Collision Corridors dashboard | Official high-crash corridor mapping | Helps identify 1-mile crash clusters |
| SCDOT Traffic Counts / TADA | AADT and traffic volume | Needed to distinguish high-crash roads from merely high-volume roads |
| SCDOT GIS data | Roadway centerlines and mapping layers | Needed for corridor length, milepoint and map analysis |
| SCDOT Programmed Project Viewer | Planned and programmed transportation projects | Needed to compare crash patterns with investment |
| FLATS MPO FY2025 Annual Obligation Report | Florence-area federally obligated projects | Shows funded projects, phases and funding programs |
| NHTSA FARS | Fatal-only crash records | Federal cross-check for fatal crashes |
NHTSA describes FARS as a nationwide census that provides yearly data on fatal injuries in motor vehicle traffic crashes, and it allows users to run fatality queries or download fatal crash data.
The most important rate formula is:
Crash rate per 100 million vehicle miles traveled = crashes × 100,000,000 ÷ (AADT × 365 × years × corridor length in miles)
Without this rate, a busy road can appear “most dangerous” simply because more vehicles use it. With the rate, the analysis can ask a more useful question: is this road producing more crashes than its traffic volume would suggest?
The public record points to five major danger corridors
The SCDPS county summaries and extracted Florence County data identify the same major roadways repeatedly: US 52, US 76, SC 51, I-95 and S-13, with additional concern around S-29, S-12, US 301 and selected intersections.
For 2023, extracted SCDPS Fact Book county-profile data reviewed for this article showed Florence County with roughly 3,212 total collisions, 13 fatal collisions, about 30 serious-injury collisions, and an estimated economic loss of about $162.6 million.
Florence County ranked around the top 10 statewide for total collisions and around the top dozen counties for fatal and serious-injury collisions. The county’s top listed roadways were US 52, US 76, SC 51, I-95 and S-13, while the top listed intersections included I-95 at SC 327, SC 51 at US 52, S-29 at US 76, I-95 at SC 403, and S-29 at SC 51.
Those locations form the backbone of the crash-hotspot map.
Florence County crash hotspot framework
| Tier | Corridor / location | Public crash signal | Project signal | Investigative finding |
| Tier 1 | US 52 / Irby Street / Lucas Street | Repeatedly appears as a top crash roadway | Multiple intersection and vulnerable road user projects | Strong danger-investment match, but exact crash density needs FOIA |
| Tier 1 | US 76 / Palmetto Street | Repeatedly appears as a top crash roadway | Corridor and bike/ped safety audit implementation projects | Strong match between crash concern and safety funding |
| Tier 1 | SC 51 / Second Loop Road / Pamplico Highway | Appears in top road and top intersection patterns | Intersection upgrades at US 52, US 76 and Holly Circle area | Strong match, especially at major junctions |
| Tier 1 | I-95 through Florence County | Top crash roadway with interchange hotspots | Signal, bridge and interstate-related projects | Safety and capacity concerns overlap |
| Tier 2 | S-13 / Cherokee Road / National Cemetery Road area | Appears in top roadway lists and connected corridors | Some nearby intersection/safety projects | Needs microdata to separate corridor danger from intersection danger |
| Tier 2 | S-29 / Cashua Drive | Appears in top intersection patterns with US 76 and SC 51 | Related corridor and intersection projects nearby | Needs crash-level review |
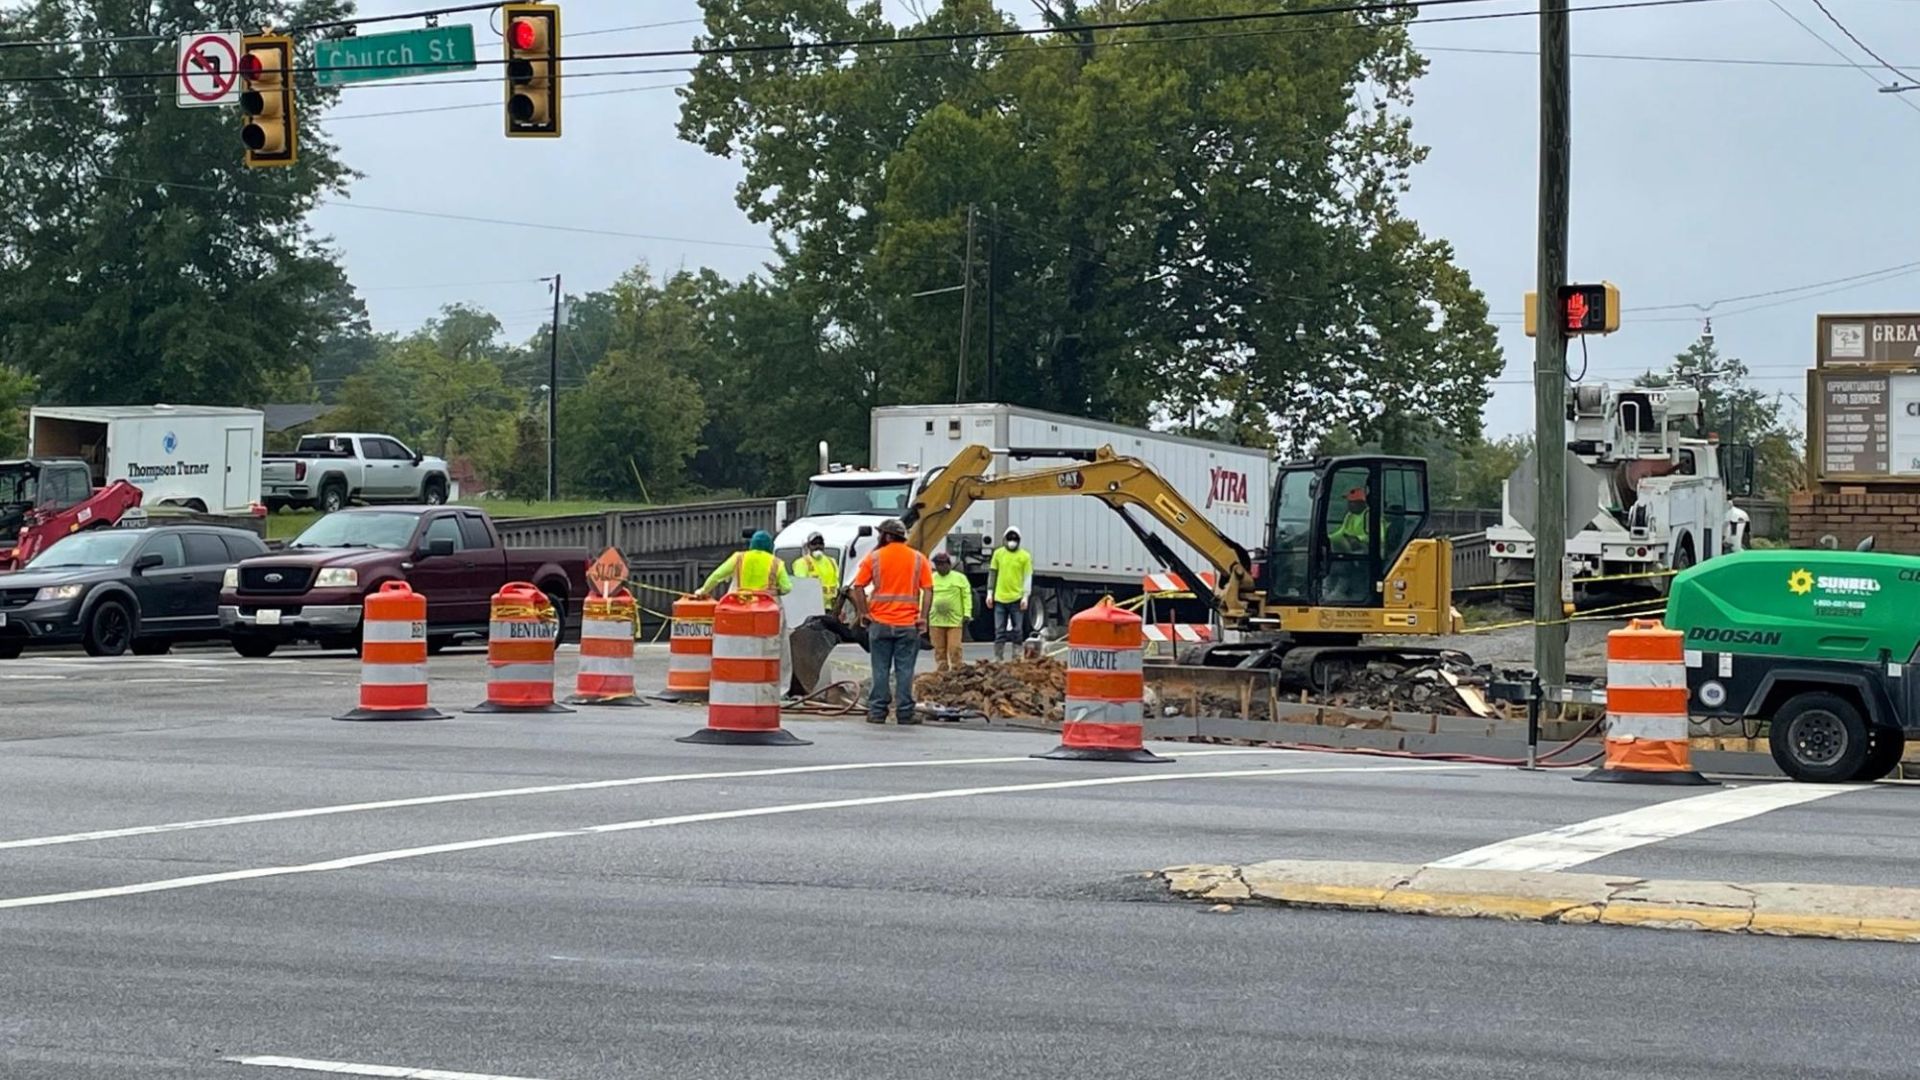
| Tier 2 | S-12 / South Church Street | Connected to vulnerable road user project | Bike/ped road safety audit implementation | Potential pedestrian/bicycle safety priority |
| Tier 3 | N. Douglas Street | Not among the top public roadway list in summary data, but safety project funded | Roadway-departure mitigation | Project suggests a specific crash pattern not visible in summary tables |
| Tier 3 | N. Dargan Street rail crossing | Safety improvement funding | Railroad warning device upgrade | Not a general crash corridor, but a targeted safety issue |
| Tier 3 | Rural secondary roads | Likely severe roadway-departure risk | Rumble-strip and roadway-departure programs | Needs crash-level data to identify overlooked segments |
US 52: Florence County’s central crash corridor
US 52 is not just a road. In Florence County, it functions as a local business corridor, a commuter route, a connector to I-95, and a link between rural and urban travel patterns. In the city, it appears under familiar street names such as Irby Street and Lucas Street. Its traffic volumes are high, and the SCDOT 2024 Florence County AADT sheet shows several US 52 segments carrying heavy daily traffic.
For example, SCDOT’s 2024 Florence traffic-count data lists US 52 from S-740/E Redbud Lane to US 301/S Irby Street at an estimated 35,600 vehicles per day, one of the highest US 52 volumes in the county. Other US 52 segments listed in the same traffic-count sheet include 31,300 AADT between E Howe Springs Road/E Redbud Lane, 26,400 AADT between Hutchinson Avenue and SC 51/Pamplico Highway, 24,100 AADT between SC 51 and Cherokee Road, and 25,400 AADT between I-95 and Pisgah Road.
That traffic volume matters. More vehicles create more conflict points: left turns, driveway access, rear-end crashes, lane changes, signal violations, pedestrian crossings and commercial-entrance crashes. But the public-safety question is whether US 52’s crash count is proportional to that traffic — or whether the road design itself is helping produce repeat crashes.
US 52 public safety indicators
| Indicator | Public record signal |
| Appears in top Florence County roadways | Yes |
| High AADT | Yes |
| Major urban and commercial exposure | Yes |
| Intersects with SC 51, US 76, US 301 and I-95 | Yes |
| Vulnerable road user project present | Yes |
| Intersection improvement present | Yes |
| Exact fatal/injury crashes per mile publicly available | Not without dashboard export or FOIA |
Projects tied to US 52
FLATS MPO’s FY2025 obligation records list a S. Irby Street / Second Loop Road / Pamplico Highway intersection improvement in Florence, with preliminary engineering obligations of $1,113,000 and $500,000 in June 2025.
The same FLATS records list a US 52 / Lucas Street corridor improvement, described as a bike/ped road safety audit implementation tied to the 2022 Vulnerable Road User Safety Project. That project covered US 52 Lucas Street from milepoint 25.07 to milepoint 27.48, with preliminary engineering obligations of $250,000 and $50,000 in 2025.
The public record therefore shows a meaningful alignment: US 52 appears in crash summaries, carries high traffic volumes, and has both intersection and vulnerable road user safety projects moving through the funding pipeline.
But the exact strength of that alignment cannot be measured without the crash-level data. The key question for the next records request is simple: within US 52, which one-mile segment had the highest number of fatal and injury crashes from 2022 through 2024?
US 76 / Palmetto Street: a corridor where vehicle danger and pedestrian risk may overlap
US 76, known locally along key sections as Palmetto Street, is another central Florence County crash corridor. It connects commercial zones, city neighborhoods, regional traffic, and I-95 access. The public record identifies it as one of Florence County’s top crash roadways, and SCDOT traffic counts show heavy daily use.
The 2024 traffic-count sheet lists US 76 at several high-volume Florence County segments: 25,100 AADT from Old Ebenezer Road to S Santiago Drive, 21,200 AADT from S Santiago Drive to SC 51/Second Loop Road, 19,100 AADT from Hoffmeyer Road/S-29 to Graham Street, 18,400 AADT from Graham Street to S Coit Street, and 20,600 AADT from E Cheves Street to N Williamson Road.
The danger is not only vehicle-to-vehicle. US 76 is also one of the corridors where public project records explicitly mention vulnerable road user safety. FLATS MPO’s FY2025 obligation report lists US 76 / Palmetto Street from milepoint 18.81 to milepoint 22.30 as a Bike/Ped Road Safety Audit Implementation project under the 2022 Vulnerable Road User Safety Project, with preliminary engineering obligations of $250,000 and $75,000 in 2025.
That matters because a corridor can be dangerous in more than one way. A road with high traffic volumes, multiple lanes, commercial driveways, signalized intersections, turning conflicts and long crossing distances can be risky for drivers and especially dangerous for pedestrians.
US 76 / Palmetto Street safety profile
| Factor | Why it matters |
| High traffic volume | More exposure and more conflict points |
| Commercial corridor | More driveways, turns and stop-and-go crashes |
| Intersections with SC 51, S-29, US 52 and other routes | Concentrated turning and signal conflicts |
| Vulnerable road user project | Official recognition of bike/ped safety concern |
| Bridge and corridor projects nearby | Infrastructure work may overlap with safety needs |
The Holly Circle / US 76 / SC 51 project
The Holly Circle area is one of the clearest examples of danger and investment overlapping. FLATS MPO’s FY2025 obligation report lists an intersection improvement at S-829/Holly Circle, US 76/West Palmetto Street and SC 51/Second Loop Road. The project includes several 2024 and 2025 obligations, including $2,737,967.13 for road construction, $265,822.05 for engineering and inspection, and additional road-construction transactions involving FLATS, City of Florence and other funding categories.
This is precisely the kind of project that should be tested against crash data. Did the intersection rank high for injury crashes? Were crashes mainly angle collisions? Rear-end crashes? Left-turn crashes? Pedestrian crashes? Did they occur at night? Was failure to yield a repeated factor?
Without crash-level data, the public can see that money is moving to the intersection. With crash-level data, the public can determine whether the design fix matches the crash pattern.
SC 51: the connector where several danger corridors meet
SC 51 is another major safety corridor because it intersects with several of Florence County’s most important roads, including US 52, US 76 and S-29. It also carries heavy daily traffic.
SCDOT’s 2024 traffic-count data shows SC 51 with some of the highest volumes in Florence County. The segment from US 301/Freedom Boulevard to US 52/S Irby Street was listed at 33,600 AADT. The segment from S Lee Drive to S Cashua Drive was listed at 30,700 AADT. The segment from US 52/S Irby Street to Fairlane Drive was listed at 28,100 AADT, while other SC 51 segments near the city carried more than 20,000 vehicles per day.
Those numbers explain why SC 51 appears repeatedly in hotspot discussions. It is not only a road. It is a conflict spine.
SC 51 high-conflict intersections to investigate
| Intersection / area | Why it should be checked |
| SC 51 at US 52 | Listed among top Florence County intersections in extracted SCDPS data |
| SC 51 at US 76 / Holly Circle | Major funded intersection improvement |
| SC 51 at S-29 / Cashua Drive | Listed among top intersection patterns |
| SC 51 near Pamplico Highway / Second Loop Road | Connected to S. Irby project |
| SC 51 commercial segments | High traffic, turning conflicts and driveway access |
The most important question for SC 51 is whether crashes are concentrated at a handful of intersections or spread along the corridor. If the crashes are mainly at intersections, the likely countermeasures may include signal timing, turn lanes, protected left-turn phasing, access management, lighting and pedestrian crossings.
If the crashes are spread along the road, the problem may be broader: speed, lane design, access density, shoulders or roadside conditions.
I-95: interstate crashes, interchange risk and the Florence County gateway problem
I-95 cuts through Florence County as both a national freight corridor and a local access route. Interstate crash patterns are different from city street crash patterns. They often involve high speeds, lane changes, congestion, merging, fatigue, weather, nighttime travel, roadway departure and crashes near interchanges.
Extracted SCDPS county-profile data identified I-95 as one of Florence County’s top crash roadways and listed key interchange intersections, including I-95 at SC 327 and I-95 at SC 403, among top Florence County crash locations.
Public project records also show I-95-related investment. FLATS MPO’s FY2025 obligation report lists a signal project at I-95 and SC 327 with a $272,701 preliminary engineering obligation in September 2025. The same report lists I-95 bridge improvements within the Great Pee Dee River floodplains, including a bridge replacement feasibility study.
I-95 safety questions
| Question | Why it matters |
| Are crashes concentrated near exits? | Could point to ramp, merge or signal issues |
| Are crashes occurring at night? | Could point to lighting, fatigue or speed |
| Are roadway-departure crashes common? | Could support rumble strips or roadside improvements |
| Are truck crashes overrepresented? | Could affect freight safety planning |
| Are interchange projects targeting the same crash types? | Determines whether investment matches danger |
I-95 is also where local and statewide priorities collide. A project can be justified by bridge condition, interstate reliability, freight movement or floodplain resilience, even if the same corridor also has crash concerns. That makes the accountability question more complicated: is the money being spent because the road is dangerous, because the infrastructure is aging, or because the corridor is economically important?
For residents, the distinction matters less than the outcome. If I-95 interchanges are repeated crash hotspots, safety should be part of every major project conversation.
Secondary roads: the places most likely to be missed
Crash summaries tend to highlight major roads because major roads have the most traffic and the most crashes. But severe crashes do not always follow total crash volume. Rural and secondary roads can produce fewer crashes but a higher share of fatal or serious-injury crashes because of speed, curves, narrow shoulders, limited lighting, long emergency response distances, roadside ditches and roadway-departure risk.
This is where Florence County needs deeper analysis beyond top-five roadway lists.
The public project record already hints at these risks. FLATS MPO’s FY2025 obligation records list N. Douglas Street from milepoint 0.00 to milepoint 2.98 for roadway-departure mitigation, with $198,024.95 obligated for road construction through an HSP Roadway Departure Mitigation funding category. The report also lists District 5 centerline milled-in rumble stripe work across several counties, including Florence, as roadway-departure mitigation.
These projects suggest that officials see a crash pattern that may not be obvious in public summary tables. Roadway-departure mitigation usually points to vehicles leaving the lane or roadway — a common factor in severe rural crashes.
Secondary-road safety questions
| Question | Why it matters |
| Which rural corridors have the highest fatal/injury crash rate per mile? | Total crashes may understate danger |
| Are roadway-departure crashes concentrated by segment? | Helps target rumble strips, shoulders and barriers |
| Are crashes happening at night or in wet weather? | Points to lighting, pavement, striping or drainage |
| Are serious crashes occurring far from urban centers? | Emergency response time may affect outcomes |
| Are secondary roads receiving safety funding? | Tests whether investment reaches beyond major corridors |
Vulnerable road users: pedestrians and cyclists need their own map
A crash map focused only on total vehicle crashes can hide pedestrian and bicycle danger. A road may not have the highest number of total crashes, but it may still be one of the most dangerous places to cross on foot.
That is why the FLATS MPO vulnerable road user projects deserve close attention. The FY2025 obligation report lists three Florence corridor improvements tied to the 2022 Vulnerable Road User Safety Project:
| Corridor | Project description | Obligation details |
| US 52 / Lucas Street MP 25.07–27.48 | Bike/Ped Road Safety Audit Implementation | $250,000 and $50,000 preliminary engineering obligations |
| S-12 / S. Church Street MP 1.28–3.5 | Bike/Ped Road Safety Audit Implementation | $250,000 preliminary engineering obligation |
| US 76 / Palmetto Street MP 18.81–22.30 | Bike/Ped Road Safety Audit Implementation | $250,000 and $75,000 preliminary engineering obligations |
These projects were listed under HSP Vulnerable Road Users funding.
The key point is that pedestrian and bicycle safety cannot be judged by total crash count alone. Pedestrian crashes are usually less frequent than vehicle crashes, but they are far more likely to cause serious injury or death. For that reason, the next layer of this investigation should build a separate map for:
- pedestrian crashes,
- bicycle crashes,
- crashes near bus stops,
- crashes near schools,
- crashes near shopping centers,
- crashes after dark,
- crashes along corridors without sidewalks,
- crashes near long crossing distances,
- crashes near high-speed multilane roads.
Vulnerable road user investigation table
| Corridor | Public project signal | Crash data still needed |
| US 52 / Lucas Street | Bike/ped safety audit implementation | Pedestrian/bicycle crashes by milepoint, lighting and crossing location |
| S. Church Street | Bike/ped safety audit implementation | Pedestrian crashes, bicycle crashes, sidewalk/crosswalk context |
| US 76 / Palmetto Street | Bike/ped safety audit implementation | Ped/bike crashes by intersection and time of day |
| Downtown-adjacent streets | Possible walking exposure | Crash-level pedestrian data |
| Commercial corridors | High crossing demand | Pedestrian crash severity and crossing distance |
The policy question is not simply whether these projects exist. It is whether they are enough.
Speed, failure to yield and lane movement appear central to Florence County’s crash pattern
The extracted SCDPS county-profile data identified several leading contributing factors for Florence County crashes, including:
- driving too fast for conditions,
- failure to yield right of way,
- improper lane usage or lane change,
- disregarding signs or signals,
- running off the road.
Those factors match the types of corridors that appear repeatedly in the public record. High-speed roads produce severe outcomes. Busy intersections produce failure-to-yield and signal-related crashes. Multilane commercial corridors produce lane-change and rear-end crashes. Rural roads produce roadway-departure crashes.
The state highway safety plan also identifies Florence among the counties with the highest reported frequencies of speed-related fatal and serious-injury collisions during the 2017–2021 period, placing it among priority counties for police traffic services projects.
That finding matters because speed is not just driver behavior. Speed is also influenced by road design: lane width, sight distance, signal spacing, access points, shoulders, lighting, enforcement presence and whether a corridor feels like a highway even when it passes through populated areas.
Crash factor and likely countermeasure matrix
| Crash factor | What it may indicate | Potential countermeasures |
| Driving too fast for conditions | Speed, weather, road design, enforcement gaps | Speed enforcement, traffic calming, better signage, pavement friction, curve warnings |
| Failure to yield | Turning conflicts, intersection design | Protected left turns, signal timing, turn lanes, roundabouts, sight-distance improvements |
| Improper lane usage/change | Multilane conflict, congestion, access density | Lane markings, access management, median controls |
| Disregarded signs/signals | Signal compliance or visibility issue | Signal upgrades, enforcement, signal backplates, timing review |
| Ran off road | Rural speed, shoulders, curves, fatigue | Rumble strips, wider shoulders, guardrails, delineators, pavement markings |
| Pedestrian crashes | Crossing exposure and visibility | Crosswalks, refuge islands, lighting, sidewalks, leading pedestrian intervals |
Danger versus investment: where the money is going
The public funding record shows that transportation investment is not ignoring Florence County’s known danger corridors. In fact, many of the roads that appear in crash summaries also appear in project documents.
FLATS MPO’s FY2025 Annual Obligation Report says that during Federal Fiscal Year 2025, 26 transportation projects within the FLATS MPO Study Area received federal funding obligations, reflected through 63 individual funding transactions. The report lists a total obligation amount of $9,147,201.26, including $7,076,105.61 in federal transportation dollars and $2,071,095.65 in state or local obligated costs.
That spending includes intersection improvements, widening work, vulnerable road user projects, roadway-departure mitigation, signal work, bridge studies and railroad safety improvements.
Major project comparison table
| Corridor / location | Project listed in public records | Funding / phase signal | Safety alignment |
| S. Irby Street / Second Loop Road / Pamplico Highway | Intersection improvement | Preliminary engineering obligations of $1,113,000 and $500,000 | Strong match with US 52 / SC 51 hotspot concern |
| Holly Circle at US 76 / West Palmetto Street and SC 51 / Second Loop Road | Intersection improvement | Road construction and engineering obligations, including $2.74 million construction item | Strong match with US 76 / SC 51 intersection concern |
| US 52 / Lucas Street MP 25.07–27.48 | Bike/ped road safety audit implementation | HSP vulnerable road user preliminary engineering | Strong vulnerable road user match |
| S. Church Street MP 1.28–3.5 | Bike/ped road safety audit implementation | HSP vulnerable road user preliminary engineering | Strong vulnerable road user match |
| US 76 / Palmetto Street MP 18.81–22.30 | Bike/ped road safety audit implementation | HSP vulnerable road user preliminary engineering | Strong vulnerable road user match |
| N. Douglas Street MP 0.00–2.98 | Roadway-departure mitigation | $198,024.95 road construction obligation | Strong if crash data shows run-off-road pattern |
| I-95 at SC 327 | Signal project | $272,701 preliminary engineering obligation | Possible match with interchange crash hotspot |
| I-95 over Great Pee Dee River floodplains | Bridge replacement feasibility study | Planning obligations listed | Infrastructure resilience more than direct crash fix |
| N. Dargan Street rail crossing | Railroad warning device upgrade | RHP safety improvement | Targeted safety improvement |
| District 5 rumble stripes | Centerline milled-in rumble stripes | Roadway-departure mitigation | Broad safety strategy for lane-departure crashes |
The pattern is encouraging but incomplete. The biggest corridors are receiving attention. US 52, US 76, SC 51 and I-95 all have visible project activity. Vulnerable road user projects are present on several urban corridors. Roadway-departure mitigation appears in the project list.
But a true accountability finding requires the next step: comparing ranked crash severity against ranked project spending.
The accountability test: are the worst corridors getting the right fixes?
A project can be located on a dangerous corridor and still miss the main safety problem.
For example, if a corridor’s most serious crashes are pedestrian crashes after dark, a resurfacing project alone may not solve the danger. If the main problem is left-turn angle crashes, the fix may need signal phasing, turn lanes or access control. If the crashes are roadway-departure crashes on curves, a new traffic signal miles away does not address the pattern.
That is why each Florence County project should be tested against the crash pattern.
Project accountability scoring model
| Score | Meaning | Example |
| Direct match | Project appears designed to address the dominant crash pattern | Pedestrian crashes + bike/ped safety project |
| Partial match | Project improves corridor but may not address main crash type | Resurfacing on high pedestrian-crash corridor |
| Indirect match | Project improves infrastructure but not clearly safety-specific | Bridge replacement near crash corridor |
| No visible match | High-crash corridor has no identified project | Dangerous rural segment without safety work |
| Needs more data | Public summaries are insufficient | Corridor appears risky but crash-level data unavailable |
Preliminary danger-investment finding
Based on currently available public sources, Florence County shows several strong matches between crash-prone corridors and funded safety projects:
- US 52 appears as a top crash roadway and has intersection and vulnerable road user projects.
- US 76 appears as a top crash roadway and has corridor, intersection and vulnerable road user projects.
- SC 51 appears in top roadway and intersection patterns and is tied to major intersection work.
- I-95 appears as a top crash roadway and has signal, bridge and interstate-related projects.
- Roadway-departure mitigation appears in project records, suggesting attention to severe lane-departure crashes.
But the public data also leaves important gaps:
- The exact one-mile corridor rankings are not yet publicly downloadable in bulk.
- Pedestrian and bicycle crash counts by Florence corridor remain unclear.
- Alcohol, drug, speed and distracted-driving flags require crash-level data.
- Time-of-day and day-of-week patterns require full crash records.
- Some rural secondary roads may be underrepresented in public summaries.
- Project lists do not always explain the crash history that justified each project.
What residents can already see
Even without the full crash database, the public record tells residents several important things.
First, the roads most often identified in Florence County crash summaries are not random. They are major corridors with high traffic volume, complex intersections and repeated exposure to turning, merging, speeding and crossing conflicts.
Second, many of those same corridors are receiving transportation investment. That includes intersection upgrades on S. Irby, Second Loop, Pamplico Highway, Holly Circle, US 76 and SC 51; vulnerable road user safety work on US 52, S. Church Street and US 76; roadway-departure mitigation on N. Douglas Street; and I-95-related signal and bridge planning.
Third, the public still cannot easily see whether the worst crash corridors are receiving the most effective fixes. That is the gap this series should continue to examine.
Why this matters
A crash is often described as a sudden event. But crash patterns are not sudden. They build over years. They appear in police reports, injury counts, insurance claims, emergency calls, fatality records, project applications and budget documents.
Florence County’s public records already show where the next questions should be asked. US 52, US 76, SC 51 and I-95 deserve close scrutiny because they combine high traffic volumes, repeated crash signals and major public investment. S-12, S-13, S-29 and other secondary corridors deserve attention because vulnerable road users and roadway-departure crashes may not always rise to the top of total-crash rankings.
The most important finding so far is not a single road name. It is the pattern: danger and investment overlap in several places, but the public still lacks the full crash-level data needed to judge whether the right fixes are being made in the right locations.
That is the next test for Florence County road safety. Not whether officials can name dangerous roads. The records already do that. The test is whether the county, city, state and MPO can show — with data — that every major safety dollar is following the crash pattern, not just the traffic pattern.